Every business decision ultimately comes down to a single question: what is the return on investment? Product configurators are no longer experimental technology. They are proven revenue drivers deployed by companies ranging from Shopify merchants to Fortune 500 manufacturers. But the question persists among decision-makers considering the investment: what exactly will a configurator do for my bottom line?
This article presents the data. Not opinions, not projections, but published research from Threekit, Shopify, Bain & Company, Aberdeen Group, Salesforce, and independent industry studies. The numbers make a compelling case: product configurators deliver measurable ROI across revenue growth, return reduction, operational efficiency, and sales cycle compression.
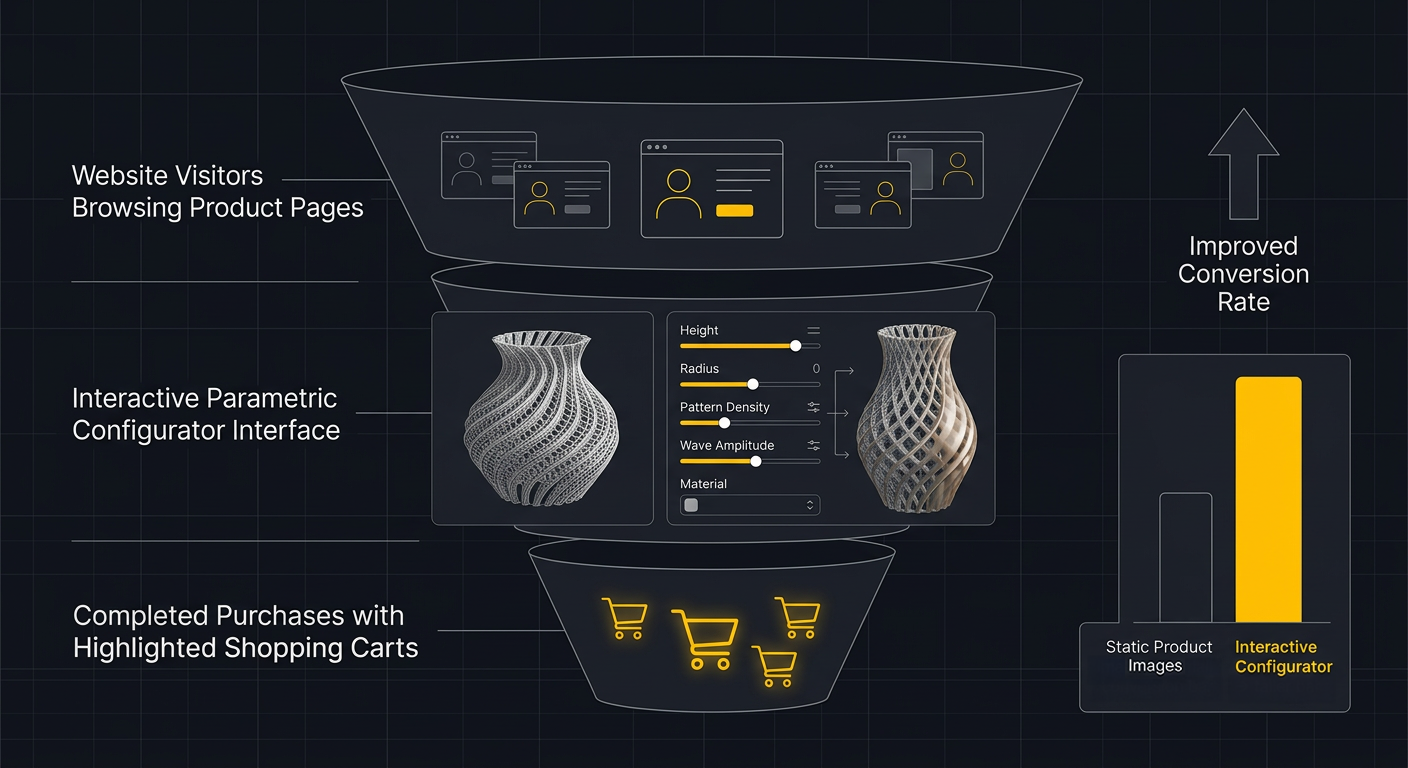
Revenue Impact: Conversion Rate Improvements That Compound
The most immediate ROI driver is conversion rate improvement. When customers can visualize and interact with a product before purchasing, they buy more frequently and with greater confidence. The data on this is unambiguous.
Shopify's internal data shows that merchants who add 3D content to their product pages see a 94% higher conversion rate on average compared to products with static images alone. That is not a marginal improvement. It is nearly a doubling of purchase likelihood from a single change to the product experience.
Threekit's research corroborates this, reporting that customers see 40% increases in conversion rates on average after deploying 3D configurators. Their data also reveals that shoppers who interact with 3D product views are 11 times more likely to buy than those who view static images only. When AR (augmented reality) is layered on top, engagement deepens further: 82% of product page visitors activate 3D views when available, and 95% of consumers prefer interactive 3D views over video playback.
These are not isolated findings. Rebecca Minkoff found that shoppers were 44% more likely to add items to their cart after interacting with 3D models and 65% more likely to place an order after using AR to preview products. Audi's pilot of a real-time 3D configurator drove a 66% increase in user engagement and a 9% increase in additional feature selection per vehicle, directly increasing per-unit revenue.
For any business selling customizable products, these conversion improvements represent the single largest line item in the ROI calculation. If you are currently converting at 2%, moving to 3-4% through better visualization doubles your revenue from the same traffic. Understanding the psychology behind why customers pay more for products they design explains the behavioral mechanism driving these numbers.
Return Reduction: Saving Money You Were Already Losing
Product returns are one of the largest hidden costs in e-commerce. The average online return rate sits at approximately 30%, compared to just 8.9% for in-store purchases, according to industry benchmarks. The primary driver? Expectation mismatch. Customers receive products that don't look or feel the way they imagined from static photos and text descriptions.
Product configurators attack this problem directly. When customers design their own product and see a photorealistic 3D rendering of exactly what they will receive, the gap between expectation and reality narrows dramatically.
BeeGraphy's configurator platform reports that businesses using their 3D configuration tools see 35% fewer returns. This figure aligns with broader industry data: Threekit reports that 3D configurators reduce returns by 35%, and Home Depot documented a 35% reduction in product returns after implementing 360-degree and 3D photography across their online catalogue. Brands employing AR visualization have reported up to a 40% decrease in return rates, potentially saving millions in reverse logistics costs annually.
The financial impact of return reduction is substantial. Returns don't just cost the sale price. They carry restocking, shipping, inspection, and refurbishment costs that can total 20-65% of the item's original price. For businesses selling personalized products where returns are especially problematic, a 35% return reduction translates directly into recovered margin.
Average Order Value: Customers Willingly Spend More
Configurators don't just drive more purchases. They drive larger purchases. The mechanism is straightforward: when customers can see how upgrades, premium materials, and add-ons affect their product in real time, they opt for higher-value options at significantly greater rates.
Bain & Company's research on product customization found that customers are willing to pay a 20% premium for customized products compared to standardized equivalents. Those same customers demonstrate 50% higher Net Promoter Scores, meaning the premium comes without sacrificing customer satisfaction. In fact, it enhances it.
The CPQ (Configure, Price, Quote) data from Aberdeen Group studies is even more striking for B2B applications: companies using CPQ solutions have an average deal size 105% larger than companies that do not. Best-in-class CPQ users achieve 5 times greater year-over-year revenue growth (15.7% vs. 2.6%) and 4.8 times greater annual margin increases (12.7% vs. 2.2%) compared to businesses without configuration tools.
The combination of real-time pricing within configurators and visual feedback creates a virtuous cycle: customers see the value of each upgrade reflected immediately in the product visualization, reducing the psychological friction that normally prevents upsells.
Operational Savings: Fewer Errors, Faster Processes
Beyond top-line revenue, configurators deliver significant operational cost reductions that often go underappreciated in ROI calculations. When customers configure their own products through a guided interface with built-in rules and constraints, the downstream benefits cascade through the entire operation.
Quoting speed. Teams using CPQ systems generate quotes 10 times faster and cut approval times by up to 95%. For businesses that currently spend hours preparing custom quotes manually, this alone can justify the investment. Automation-driven quoting improves overall sales cycle efficiency by approximately 36%.
Error elimination. CPQ software eliminates 40% of human errors in configuration and quoting processes. In manufacturing environments specifically, quoting errors drop by up to 36%, directly improving win rates and customer trust. Configuration accuracy in automotive and industrial sectors has improved by 47% with CPQ adoption.
Manufacturing precision. When a configurator generates exact specifications rather than relying on sales representatives to interpret customer requests, manufacturing errors decline. Less scrap, less rework, fewer customer complaints. For businesses producing complex configurable products, the reduction in wasted materials and labour can represent a 5-10% improvement in production cost efficiency.
Support cost reduction. Configurators that provide clear visualization and real-time pricing reduce the volume of pre-sale questions customers need answered. BeeGraphy notes that when customers can configure and visualize independently, service costs and support tickets decline measurably.
Sales Cycle Compression: Closing Deals Faster
Time is money, and configurators compress the time between initial interest and closed deal. Aberdeen Group research cited by Salesforce found that organizations using CPQ software experience a 28% reduction in the length of their sales cycles and 49% higher proposal volume per representative per month.
This cycle compression matters enormously for cash flow and resource allocation. A sales team that closes deals in 30 days instead of 42 can handle more pipeline volume with the same headcount. For businesses scaling their customization operations, this efficiency gain is what makes growth sustainable rather than chaotic.
The mechanism is intuitive: when a customer can configure, visualize, and price a product in a single session, the back-and-forth of traditional quoting collapses. No waiting for a sales engineer to draw up specifications. No "let me check with the factory on that option." The configurator handles validation, pricing, and visualization simultaneously, removing days or weeks of friction from the sales process.
A Worked Example: ROI for a $500K Custom Product Business
Let's make this concrete. Consider a hypothetical business selling custom furniture online with $500,000 in annual revenue, a 2% conversion rate on 50,000 annual visitors, a 25% return rate, and an average order value of $500. Here is what the data suggests a product configurator would deliver:
Conversion rate improvement. Using a conservative 40% conversion lift (Threekit's average, well below Shopify's 94% figure), conversions move from 2% to 2.8%. That's 1,400 orders instead of 1,000 — an additional $200,000 in annual revenue at the current AOV.
Average order value increase. Applying Bain's 20% customization premium, AOV rises from $500 to $600. Applied to 1,400 orders, total revenue reaches $840,000 — a $340,000 increase before accounting for return savings.
Return reduction. With a 35% reduction in returns (the BeeGraphy and Threekit benchmark), the return rate drops from 25% to 16.25%. On 1,400 orders, that's 123 fewer returns. At an estimated $150 per return in handling, shipping, and lost inventory costs, that saves approximately $18,400 annually.
Operational savings. Reduced quoting time, fewer manufacturing errors, and lower support volume conservatively save 10-15 hours per week for a small team. At a blended cost of $40 per hour, that is roughly $26,000-$39,000 in annual labour savings.
Total estimated annual impact: $384,000-$397,000 in additional revenue and cost savings on a $500,000 baseline. Even if we halve these projections to account for implementation realities, a $192,000-$198,500 annual return on an investment that typically costs $3,000-$30,000 per year for a configurator platform yields a payback period measured in weeks, not years.
Explore the configurator pricing plans to see how the investment compares to these projected returns for your business.
Why the ROI Is Structural, Not Temporary
Unlike a marketing campaign that delivers a one-time spike in traffic, a product configurator generates compounding returns. Every month, the same conversion improvements, return reductions, and operational efficiencies apply to all traffic and all orders. As the business grows, the absolute dollar impact of these percentage improvements scales proportionally.
There is also a competitive dimension. As more businesses in every industry adopt configurators, the absence of one becomes a competitive disadvantage. Customers who experience interactive 3D configuration on one site develop expectations that carry to every other site they visit. The cost of not having a configurator — measured in lost conversions and customers choosing competitors — increases every year.
Building the Business Case
The data across multiple independent sources tells a consistent story. Product configurators deliver 40-94% conversion lifts, 35-40% return reductions, 20-105% increases in order or deal value, 28% shorter sales cycles, and measurable operational savings in quoting, manufacturing accuracy, and support volume. For any business selling configurable or customizable products, the ROI is not speculative. It is documented, repeatable, and substantial.
The question is no longer whether a product configurator will deliver ROI. It is how quickly you can capture it. Configurator.tech provides the platform to turn these data-backed projections into your business reality. Get in touch with our team to model the specific ROI for your product line and customer base.